


Featured article

If you are a regular reader of our newsletters, if you work in Ad Monetization, Product, Player Support or simply play mobile games, you know all too well that as an industry, we have reached the lowest point ever when it comes to ad quality. We covered this topic extensively in our Newsletter #7 - Click Happens and Then What? How Ad Quality Impacts Churn explaining why ad quality matters, how bad ads in mobile games induce churn and how different ad networks score on various metrics such as CTR, auto clicks, ad duration and churn. In this edition, we share a real-world ad quality optimization case study of a client of ours whom we helped improve ad quality without having a negative impact on ad revenue.
#1 The Inventory
- Apps: Three F2P (Free2Play) mobile games. On a spectrum from hyper-casual to hardcore, they tend to be more on the casual/core experience.
- Mediation: Applovin MAX
- Ad networks used: 11. All the usual suspects, including Applovin, Google AdMob, UnityAds, ironSource, Liftoff Monetize, etc.
- Ad formats used: Rewarded video ads only
- Geo distribution: 40% - 50% of ad revenue comes from English-speaking countries (United States, United Kingdom, Australia, Canada, New Zealand, Ireland)
- Primary monetization source: IAP (In-App Purchases). Ads represent a much smaller portion of revenue (but still significant!).
#2 The starting setup
The initial setup that we had was default in every sense of that word. This means:
- No categories blocked
- No advertisers blocked
- No apps blocked
- No changes to default ad network templates
#3 The experiment itself
We agreed with our client that we should do something to improve the quality of ads that we were showing and consequently, the player experience with ads in mobile games. This was especially important because the games are making the majority of their revenue from IAPs so we wanted to reduce the risk of ads churning payers away. So, what changes did we make?
- We blocked the most problematic ad categories. Think of alcohol, tobacco/cigars, reference to sex, drugs & supplements, etc. We wanted to avoid showing these ads altogether.
- We changed the default ad network templates. For some ad networks, it is possible to change some of the ad template elements from within their dashboard, while for others, you need to have a contact point with the ad network and then you request a change from them.
The changes we performed were executed on an account level - impacting all games. In our analysis, we focused on the three biggest games in the portfolio.
As you probably know, this kind of experiment is not possible to do via AB test because, with few exceptions, these controls are set on an app level (within each ad network dashboard). Because of this, we had to measure the impact of these changes on a before/after basis.
Our intention was to apply these changes with all ad networks at the same time (same day) but this turned out to be more difficult than expected (even with advanced notice to ad networks). Because of this, when we analyzed the data before the change and after the change, we omitted the days where the setup was changed only on some ad networks. This (few days) period wasn’t completely ignored - we analyzed it separately to ensure that everything is taken into account.
#4 The risks
We were warned about the biggest risk for this experiment by the networks themselves. Some of them expressed quite strong concerns that tampering with their default ad template settings would lead straight to a significant (up to 20%) decrease in eCPM.
However, this was not the first time we made such changes. Over the past few years, we made similar changes numerous times, without ever being able to identify any eCPM decrease connected with this. What was different this time:
- The templates have never been as aggressive as now.
- We now have more tools at our disposal to track, not only eCPM, but also metrics that would tell us whether ad quality actually improves.
Based on all of this, we agreed with our client that this is the risk worth taking and we proceeded with the test.
#5 The Impact Measurement
As explained before, our primary intention was to improve ad quality without reducing ad revenue. For that reason, a major focus of our analysis was determining how eCPM changed after new ad templates were introduced.
On the quality side of things, we relied on Unity’s Ad Quality tool to measure the impact of our changes. From all available metrics, we decided to focus on:
- Ad duration
- D1, D3 and D7 churn
We analyzed eCPM data per game (Game 1, Game 2, Game 3), platform (iOS and Android), per ad network and per geo (we focused on analyzing English-speaking countries).
#6 Control Factors
As I wrote a couple of years ago, there are at least Ten Reasons Why eCPM is the Most Useless Metric in Ad Monetization. If you haven’t read it - in summary eCPM depends on so many different factors that it can’t be analyzed in isolation from those factors. For that reason, we paid attention to the following:
- % DEU (Daily Engaged Users) that were IAP Payers (vs. IAP Non-Payers)
- % DEU coming from UA sources (vs. Organic Users)
- % DEU coming from different countries
The reasoning is as follows: The higher the portion of DEU coming from IAP Paying Users, users that come through User Acquisition and users from English-speaking countries, the eCPM will be higher.
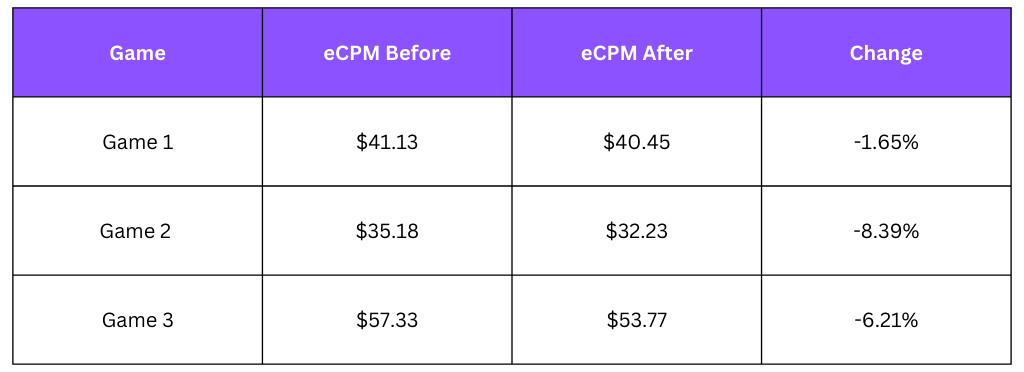
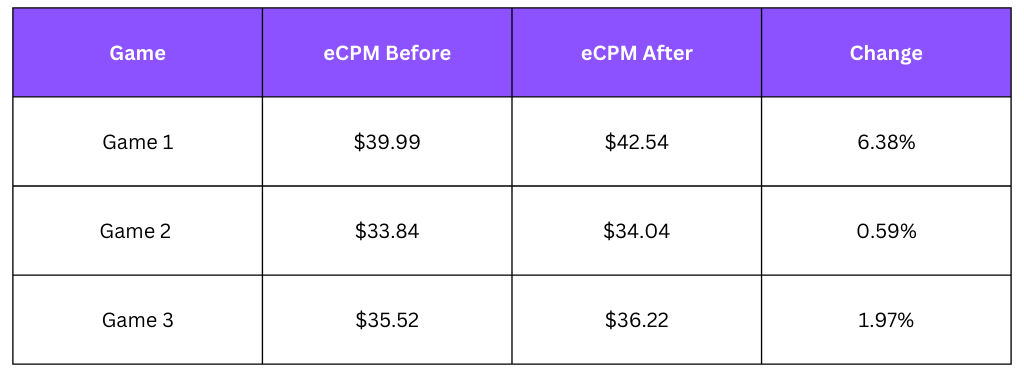
#7 The eCPM Impact
#8 Results Interpretation
In the tables above we see some decrease in eCPM on iOS and no decrease (even an increase!) in eCPM on Android. But what does this mean? Were completely different results per platform driven by exactly the same changes?
Not exactly. Remember that, as part of our analysis, we were paying attention to how many ad viewers are payers, how many of them came from UA and what was their geo distribution? Well, this is where these become very important.
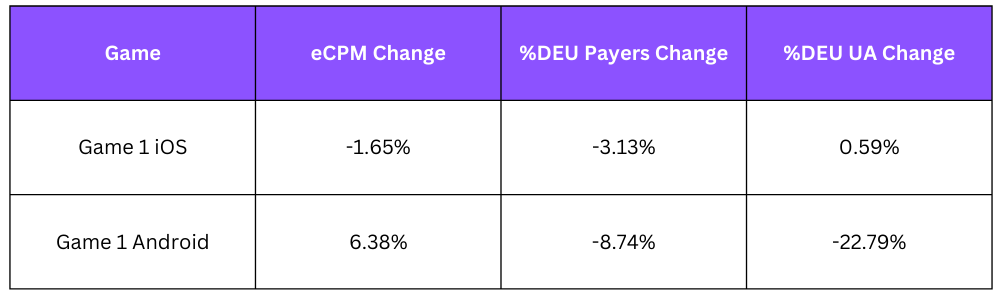
So, the change in the viewer composition on iOS is a more likely explanation for a slightly lower eCPM than the actual changes we performed. Slightly higher share of ad viewers that came from UA sources (+0.59%) but at the same time decrease in the share of ad viewers that are payers (-3.13%). This combined, resulted in eCPM being lower than in the baseline period.
On Android, we can see that despite a negative trend in control metrics, eCPM didn’t decrease.
A final thought on eCPM changes topic. eCPM changes every single day due to change in demand. This is pretty much a randomness factor that we accept as noise, as there is not much to be done about it.
#9 Ad Quality Impact
Here is one example of what happened with ad duration and churn when changing the default ad templates.
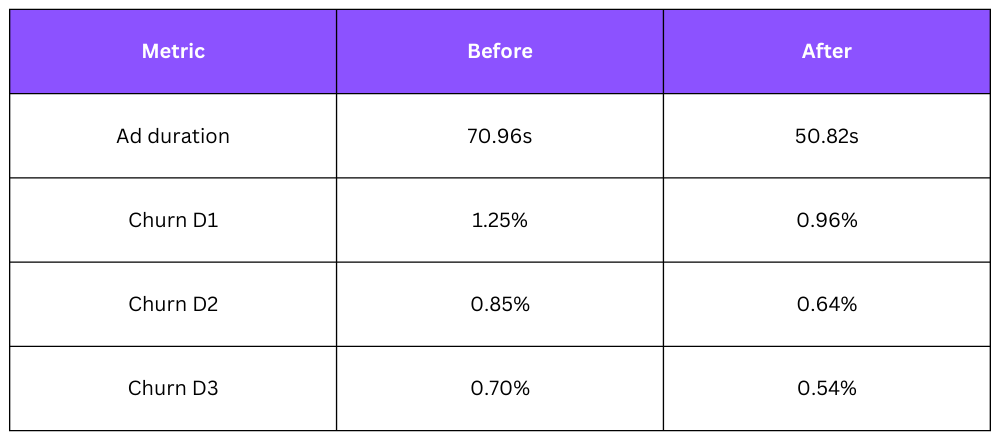
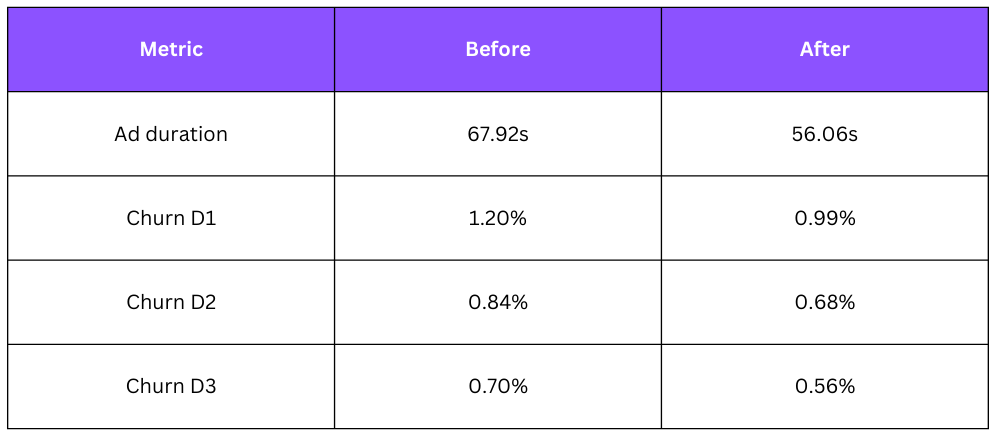
We observed a similar trend on Games 1 and 3 as well.
- Ad duration decreased between 12.8% and 28.4%, depending on the game.
- Churn decreased as well in all games.
Lastly, we noticed that the share of impressions coming from the networks that were causing the highest churn (in our case Applovin, Moloco and Mintegral) went down from 40% to 35%. It’s possible that other, less aggressive ad networks had a more fair chance to win the auction, with the ad template being more similar across networks.
#10 The Conclusion
Tempering with ad templates and blocklists is an experiment definitely worth doing. In this round of testing, we confirmed our previous experience that there is no proof that introducing more conservative templates across networks brings a material decrease in eCPM. Consequently in this experiment, we were able to keep ad revenue intact. At the same time, we were able to confirm a reduction in average ad duration and the number of players that churn from our games due to ads.
In summary, experiments such as these require a lot of effort. Making changes in the dashboards, requesting the changes from the networks that don’t have this option as self-serve, analyzing eCPM and control parameters, ad duration, churn, implementing Unity Ad Quality SDK if you don’t have it. And the results? Hopefully stable ad revenue and better user experience. Need help with any of these items? Don’t be shy and do reach out! 😉


